The two most important maps we have of colonial Saigon — an 1882 cadastral survey and its 1898 revision — have never been compared as spatial data. They've been studied individually, scanned, and put online. But no one has asked: which buildings appear in both? Which ones were built or demolished in those sixteen years? And can that shared knowledge help us georeference the maps themselves?
The answer to the last question turns out to be yes — and it changes how we think about the whole problem of historical map vectorization.
The standard approach and its cost
Georeferencing a historical map means manually clicking corresponding points between the old map and a modern coordinate reference. You click a church corner on the 1882 map, click the same spot on a modern satellite image, repeat 15–20 times, and a polynomial transform snaps the old map into place. This works. It takes about an hour per map, requires you to find recognizable landmarks that still exist, and has to be done again from scratch for every new map even if it covers the same area.
Vectorization — tracing the actual building outlines as digital polygons — is a separate problem that usually comes after georeferencing and is even more labour-intensive. For 500 buildings across two maps, manual tracing would take weeks.
What SAM changes
Meta's Segment Anything Model (SAM) is a vision foundation model that segments objects in images with no training data. Feed it a map tile and it finds every visually distinct region — building blocks, streets, courtyards, open land — as clean polygon masks. It works well on printed maps because the visual contrast is high and consistent: orange fills, grey hatching, cream open space, black outlines. The 1882 and 1898 Saigon maps happen to use exactly this kind of legible polychrome symbology, consistently applied across both surveys.
The pipeline fetches tiles directly from the IIIF Image API — no full-image downloads, no TIFF conversion. A 12,000 × 9,000 pixel scan becomes roughly 540 overlapping 512×512 JPEG tile requests, each processed by SAM independently, with tile-local coordinates offset back to full-image pixel space. The result is several thousand pixel-space building polygons per map, stored in a database with no geographic coordinates attached yet.
The pixel-first architecture
That last point is deliberate. We store building outlines as pixel coordinates — x and y positions on the original scan — rather than longitude and latitude. Geographic coordinates are computed on demand by passing the pixel polygon through the Allmaps georeferencing annotation for that map. The annotation holds the ground control points; the transform is applied at read time.
This means fixing or improving a georeferencing annotation automatically improves every building footprint derived from it. The spatial reference lives in the annotation, not in the building polygon. The two concerns — where the map sits on Earth, and what shapes are on it — are handled independently.
Buildings as their own ground control
Here is where things get interesting. Once you have pixel-space building polygons for both the 1882 and 1898 maps, you can ask: which buildings appear in both? A building that existed in 1882 and was still standing in 1898 will have nearly the same shape in both surveys — same proportions, same footprint, same relationship to the street. Mathematically, its polygon will have similar Hu moments (a rotation- and scale-invariant shape descriptor) in both maps.
We match building shapes across the two pixel-space polygon sets, use RANSAC to reject mismatches, and end up with a set of stable buildings identified as corresponding pairs. Each pair gives us one ground control point: the pixel location in the 1882 map and the pixel location in the 1898 map are the same real-world building. If the 1882 map is already georeferenced, those pixel positions can be converted to longitude/latitude and used directly as GCPs for the 1898 map — automatically, with no manual clicking.
The first map in the series still needs manual georeferencing. Every subsequent map can be handled by the buildings themselves.
The change dataset falls out for free
The matching step classifies every building polygon along the way:
- Stable — matched in both maps, similar shape. Built before 1882, still standing in 1898.
- New — present in 1898, absent in 1882. Constructed between the two surveys.
- Demolished — present in 1882, absent in 1898. Removed in the same period.
- Modified — partial overlap. Flagged for review.
Each polygon gets a valid_from and valid_to date. This is the 1880–1900 Saigon building dataset — the first machine-readable spatial record of the colonial city — and it emerges directly from the georeferencing step, not as a separate effort.
What this means for maps that don't fit WGS84
There's a broader implication worth naming. The vector-to-vector method doesn't require either map to be georeferenced to WGS84. If your goal is to compare two maps of the same place — to find what they agree on and what each one shows that the other doesn't — the comparison can happen entirely in feature space. Geographic coordinates are optional.
This matters for indigenous and pre-colonial maps, which often organise space by relational distance, travel time, or political logic rather than metric coordinates. Conventional georeferencing asks: how wrong is this map compared to WGS84? The implicit answer frames spatial difference as error. Vector-to-vector comparison asks instead: what do these two representations of the same territory share? The shared features define their own reference frame, internal to the maps, and WGS84 can be layered on later where it's useful — not required as a precondition for learning anything.
For Vietnam specifically: a pre-colonial Vietnamese road map (lộ đồ thư) and a French colonial cadastral survey of the same territory could be compared by stable features — river confluences, coastal inlets, major settlements — without either being subordinated to the other's coordinate logic. The French map would serve as the georeferenced anchor not because it is more correct but because it is more densely pinned to WGS84. The Vietnamese map would retain its own spatial epistemology.
Pipeline advances since the first draft
Several refinements emerged from reading the NYPL Building Inspector paper (Arteaga 2013) and Morlighem's TU Delft thesis on automated 3D city model reconstruction from historical maps (2021).
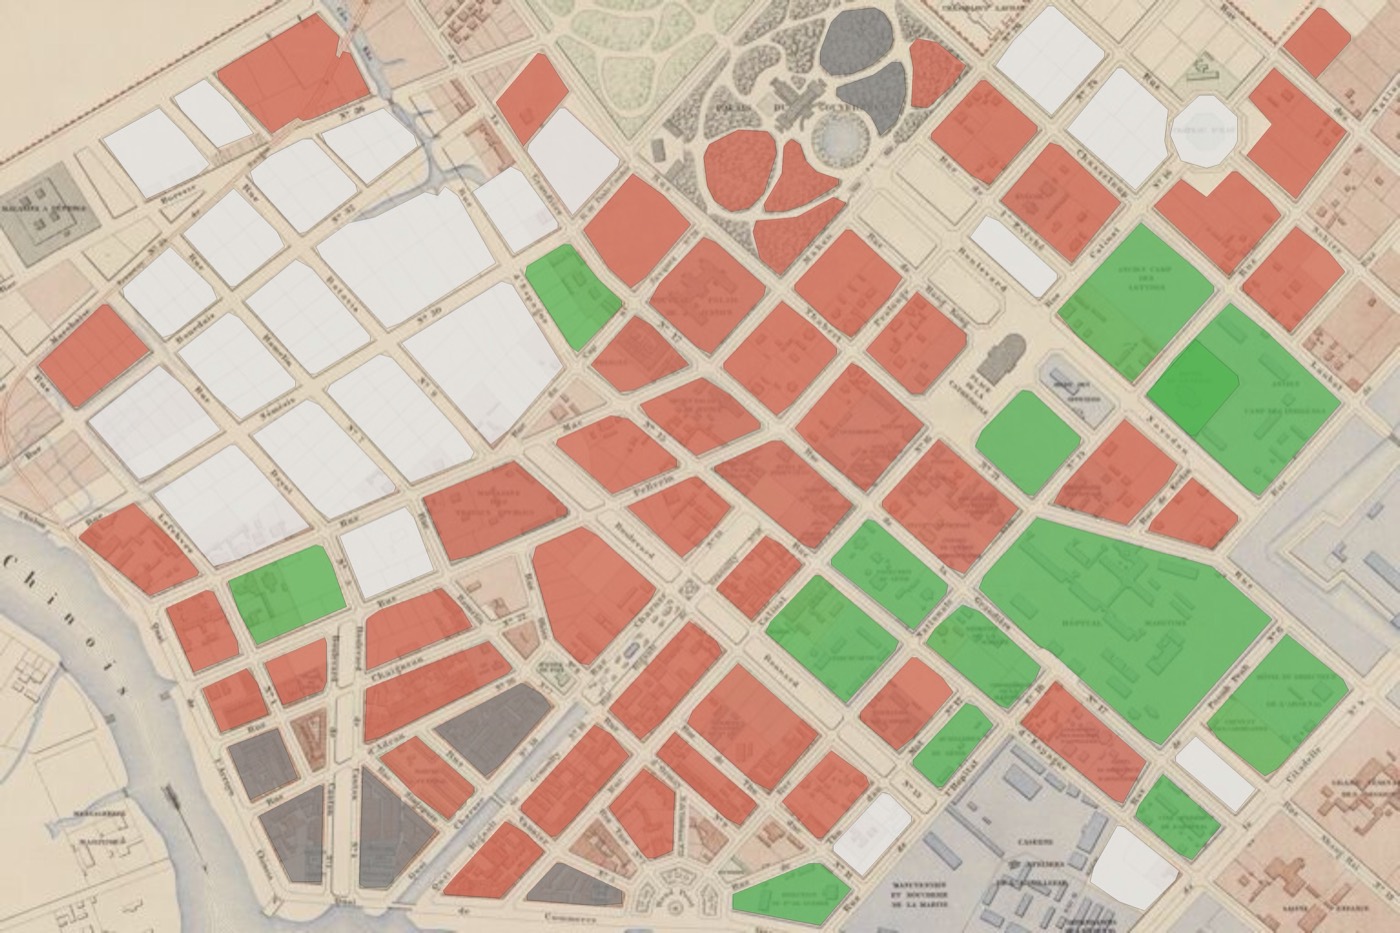
Colour classification. Raw SAM output accepts everything — streets, courtyards, text characters — as candidate building polygons. The 1882/1898 Saigon maps use a consistent five-class polychrome legend: salmon for private property (particulières), green for communal holdings, cream for unassigned domain land, blue-grey hatching for military buildings, dark grey hatching for local-service buildings. We now classify each SAM polygon by the average RGB of its interior pixels against this calibrated palette, discarding anything closer to the paper background than to any property class. The property class is stored in the feature_type field, so the full cadastral typology survives into the database rather than everything being labelled "building".
Two-phase segmentation. A single pass at any one scale misses either large city blocks (too small a region) or individual buildings (too coarse a downscale). We now run a dedicated plot pass at 8× downscale (4096 px region → 512 px SAM input) and separate building passes at 2× and 1×. At 8× downscale, building-boundary ink lines (2–3 px wide) fall below the rendering threshold and disappear, causing whole city blocks to appear as single solid polygons. At 2× and 1×, those lines are preserved and SAM segments individual footprints. The deduplication step keeps both levels when a small building polygon is contained within a larger block polygon — a hierarchical pair, not a duplicate.
Shape regularisation (building passes only). Individual buildings are nearly always rectangular; SAM traces them with slightly jagged outlines following ink roughness. We snap near-rectangular polygons (area/MBR ratio ≥ 0.75) to their minimum bounding rectangle. City blocks are explicitly excluded from this step: colonial Saigon blocks follow diagonal street grids and have trapezoidal or L-shaped outlines that must be preserved as traced.
First test results
The plot pass ran successfully on a 1,200 × 1,200 px crop of the 1882 map interior. 91 city-block polygons were retained after deduplication, classified as: 46 particulier (private), 24 non affectées (unassigned domain), 14 communal, 7 local service (flagged for review — these are cross-hatched and SAM fragments them). The preview below shows the processed tiles with polygons colour-coded by class.
Where this stands
The 1882 map is georeferenced and on Internet Archive. The plot pass is validated. The building pass is next, followed by the full-map run, then the 1898 preparation (Pixelmator seam correction on the BnF Gallica composite scan). Once both maps are vectorized, the vector-to-vector matching step — Hu moment descriptors, mutual-best-match, RANSAC — produces the change classification and auto-georefs the 1898 map simultaneously.
The full pipeline code is in the VMA repository. If you're working on historical city reconstruction — Hanoi, Phnom Penh, Manila, any city with a colonial-era cadastral survey — this architecture is designed to be forked.